CS 424 Spring 2021
David Shumway
Menu: Introduction | Data | Interesting notes on the data
Project 1 - "Power and the Passion"
A web-based application using R, Shiny, ggplot2, and Shiny Dashboard to visualize electrical power generation in the US from 1990-2019
Online at: https://parrot.shinyapps.io/cs424/
Author: David Shumway
Overview:
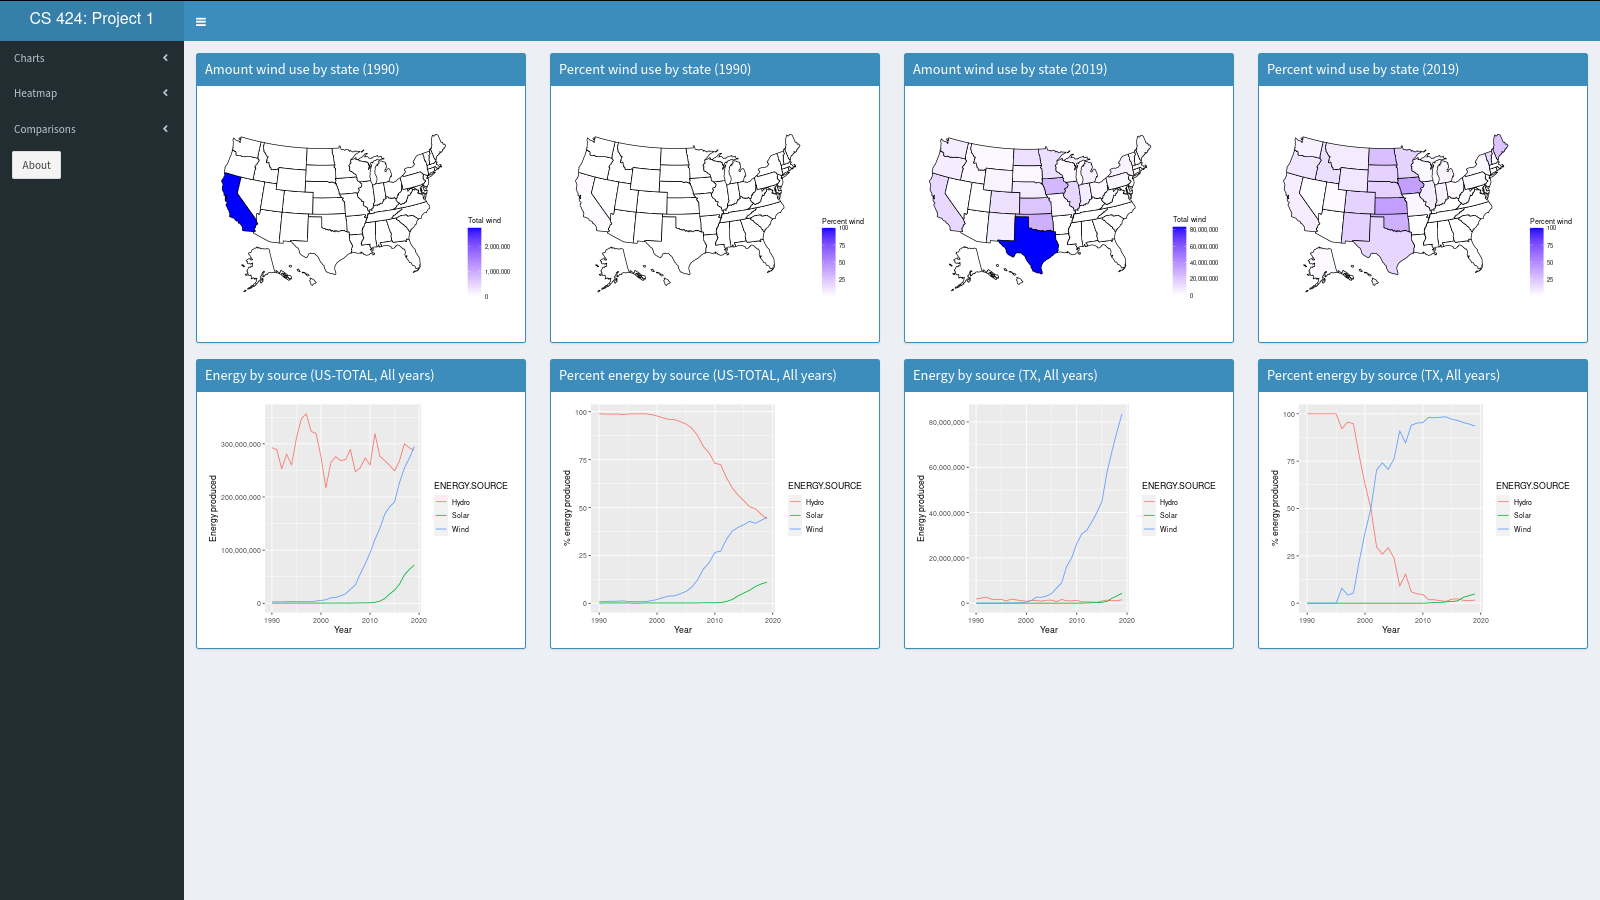
This application provides visualizations of power production data from all 50 US states and the District of Columbia, as well as from the US as a whole, for the time period 1990-2019. Visualizations include stacked bar chart, line chart, tabular data, and heatmap. Nine types of energy production are represented: Coal, Geothermal, Hydro, Natural Gas, Nuclear, Petroleum, Solar, Wind, and Wood. A side-by-side split-screen view allows users to compare between different different regions and energy mixes.
Video walkthrough of the application (online at https://youtu.be/o6OA6xLABy4).
How to use the program:
The program may be run through any standard browser by visiting the following website: (https://parrot.shinyapps.io/cs424/).
What you can do with the program:
This application provides visualizations of power production data from all 50 US states and the District of Columbia, as well as from the US as a whole, for the time period 1990-2019.